 Due to the increasing use and abuse of illicit and prescription drugs, employers, public policy decision makers, law enforcement, media and the general public all have an interest in assessing past, current and emerging drug use trends. As such, this installment in our Assessing Drug Use Trends in the United States series uses several renowned sources of drug use data to explore the latest trends in marijuana use.
According to the National Survey on Drug Use and Health (NSDUH), marijuana remains the most commonly used illicit drug in the United States with an estimated 19.8 million users. Current usage rates were similar between 2002 and 2009 and have shown steady increases through 2013. While the usage rates in 2012 and 2013 were similar, they are significantly higher than 2002 through 2011. Similarly, usage among respondents not subject to drug testing by their employer showed similar rates between 2002 and 2009 with sharp increases since that time. In contrast, among those subject to drug testing, current usage was similar between 2002 and 2011 and increased in 2012. This data represents a greater than 60% higher usage of marijuana among those not subject to drug testing.
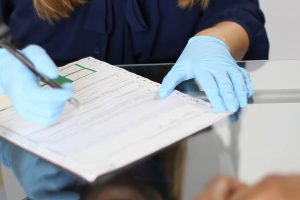
Workplace urine drug testing data from the Quest Diagnostics Drug Testing Index™ (DTI) revealed declining positivity rates between 1999 and 2011 but an increase of 5% or more in both 2012 and 2013. Compared to oral fluid testing, urine positivity rates were higher in 2003 and 2004, rates were approximately equal in 2005 through 2007, and oral fluid positivity rates have been higher than urine since 2008. In 2013, oral fluid positivity for marijuana was 5.1% compared with 2.1% in urine drug tests. This rate is also higher than hair (4.3%) and is all the more remarkable given the shorter detection window for marijuana in oral fluid drug tests compared with both urine and hair. A significant driver for these findings could be that oral fluid collections are observed while urine drug test collections are not. According to the Drug Abuse Warning Network (DAWN), marijuana remains the second most frequently mentioned illicit substance in ER visits, behind cocaine, increasing 19% between 2009 and 2011.
Data from the National Forensic Laboratory Information System (NFLIS) shows declines in cannabis/THC identifications between 2009 and the first half of 2013 in all regions of the country. However, it remains the most commonly reported drug in the Midwest (40%), Northeast (34%) and South (29%).
Of increasing interest to employers are the seemingly relaxing attitudes towards marijuana. There are currently 23 states with “medical” marijuana statutes, two of which also permit “recreational” use. An analysis of urine drug test data from the those two states – Colorado and Washington – showed marijuana positivity rates increased 20% and 23%, respectively, in the general workforce between 2012 and 2013, compared to the 5% average increase among the U.S. general workforce in all fifty states. However, both Colorado and Washington experienced dramatic increases in marijuana positivity rates prior to legalization at the end of 2012. From 2009 to 2010, Colorado experienced a 22% increase and Washington a 10% decline in positivity. From 2011 to 2012, Colorado experienced a 3% increase and Washington an 8% increase in positivity. Consequently, it is too early to predict the longer term impact on employer drug test positivity in states with recreational and/or medical marijuana statutes.
For more information about drug testing, visit our website.
Join us over the next few weeks as we use five renowned sources of drug use data to compare and contrast the latest trends in illicit drug use. Read the introductory post to learn more about this series.


According to the National Survey on Drug Use and Health (NSDUH), marijuana remains the most commonly used illicit drug in the United States with an estimated 19.8 million users. Current usage rates were similar between 2002 and 2009 and have shown steady increases through 2013. While the usage rates in 2012 and 2013 were similar, they are significantly higher than 2002 through 2011. Similarly, usage among respondents not subject to drug testing by their employer showed similar rates between 2002 and 2009 with sharp increases since that time. In contrast, among those subject to drug testing, current usage was similar between 2002 and 2011 and increased in 2012. This data represents a greater than 60% higher usage of marijuana among those not subject to drug testing.
Workplace urine drug testing data from the Quest Diagnostics Drug Testing Index™ (DTI) revealed declining positivity rates between 1999 and 2011 but an increase of 5% or more in both 2012 and 2013. Compared to oral fluid testing, urine positivity rates were higher in 2003 and 2004, rates were approximately equal in 2005 through 2007, and oral fluid positivity rates have been higher than urine since 2008. In 2013, oral fluid positivity for marijuana was 5.1% compared with 2.1% in urine drug tests. This rate is also higher than hair (4.3%) and is all the more remarkable given the shorter detection window for marijuana in oral fluid drug tests compared with both urine and hair. A significant driver for these findings could be that oral fluid collections are observed while urine drug test collections are not. According to the Drug Abuse Warning Network (DAWN), marijuana remains the second most frequently mentioned illicit substance in ER visits, behind cocaine, increasing 19% between 2009 and 2011.
Data from the National Forensic Laboratory Information System (NFLIS) shows declines in cannabis/THC identifications between 2009 and the first half of 2013 in all regions of the country. However, it remains the most commonly reported drug in the Midwest (40%), Northeast (34%) and South (29%).
Of increasing interest to employers are the seemingly relaxing attitudes towards marijuana. There are currently 23 states with “medical” marijuana statutes, two of which also permit “recreational” use. An analysis of urine drug test data from the those two states – Colorado and Washington – showed marijuana positivity rates increased 20% and 23%, respectively, in the general workforce between 2012 and 2013, compared to the 5% average increase among the U.S. general workforce in all fifty states. However, both Colorado and Washington experienced dramatic increases in marijuana positivity rates prior to legalization at the end of 2012. From 2009 to 2010, Colorado experienced a 22% increase and Washington a 10% decline in positivity. From 2011 to 2012, Colorado experienced a 3% increase and Washington an 8% increase in positivity. Consequently, it is too early to predict the longer term impact on employer drug test positivity in states with recreational and/or medical marijuana statutes.
For more information about drug testing, visit our website.
Join us over the next few weeks as we use five renowned sources of drug use data to compare and contrast the latest trends in illicit drug use. Read the introductory post to learn more about this series.