Due to the increasing use and abuse of illicit and prescription drugs, employers, public policy decision makers, law enforcement, media and the general public all have an interest in assessing past, current and emerging drug use trends. As such, this installment in our Assessing Drug Use Trends in the United States series uses several renowned sources of drug use data to explore the latest trends in opiate use.
According to the National Survey on Drug Use and Health (NSDUH), there were an estimated 4.5 million current non-medical users of prescription pain relievers in 2013 – which is similar to those in 2011 (4.5 million) and 2012 (4.9 million). The number and percentage of current non-medical users of the pain reliever OxyContin® in 2013 (492,000) were similar to the numbers in 2007 to 2012 (ranging from 358,000 to 566,000).
Data from the Quest Diagnostics Drug Testing Index™ reported positivity declines for certain prescription opiates in urine drug tests. Oxycodones positivity declined 8.3% between 2012 and 2013 and 12.7% between 2011 and 2012 in the U.S. general workforce. Four states experienced double-digit declines in oxycodones positivity rates in both 2012 and 2013 – Florida, Massachusetts, New Jersey and Ohio. Hydrocodone positivity remained at 1.3% between 2012 and 2013, which is down slightly from its high of 1.4% in 2011.
According to the Monitoring the Future (MTF) study, hydrocodone use by 8th and 10th graders was unchanged while use by 12th graders decreased from 7.5% in 2012 to 5.3% in 2013. OxyContin® use remains unchanged among 8th (2%) and 10th graders (3.4%) and is down slightly among 12th graders (3.6%).
ER data from the Drug Abuse Warning Network (DAWN) revealed that oxycodone is the most frequently mentioned narcotic pain reliever. And data from the National Forensic Laboratory Information System (NFLIS) found that hydrocodone and oxycodone accounted for 68% of all narcotic painkillers but declined between 2011 and 2013 after increasing dramatically between 2002 and 2010.
These various datasets help provide a broader, more comprehensive understanding when assessing drug use trends in the United States. While the rates may vary, they generally provide the same directional information and can help inform employers of what drugs they may need to be concerned about in their drug-free workplace programs.
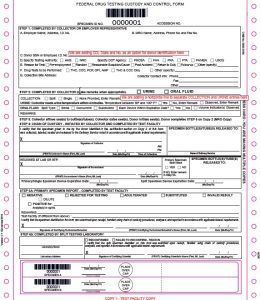
For more information about drug testing, visit our website.
Over the past few weeks, we used five renowned sources of drug use data to compare and contrast the latest trends in illicit drug use. Read the introductory post to learn more about this series.
 Your Privacy Choices
|
Privacy Notices
|
Terms
|
Language Assistance / Non-Discrimination Notice | Asistencia de Idiomas / Aviso de no Discriminación | 語言協助 / 不䈚視通知


Due to the increasing use and abuse of illicit and prescription drugs, employers, public policy decision makers, law enforcement, media and the general public all have an interest in assessing past, current and emerging drug use trends. As such, this installment in our Assessing Drug Use Trends in the United States series uses several renowned sources of drug use data to explore the latest trends in opiate use.
According to the National Survey on Drug Use and Health (NSDUH), there were an estimated 4.5 million current non-medical users of prescription pain relievers in 2013 – which is similar to those in 2011 (4.5 million) and 2012 (4.9 million). The number and percentage of current non-medical users of the pain reliever OxyContin® in 2013 (492,000) were similar to the numbers in 2007 to 2012 (ranging from 358,000 to 566,000).
Data from the Quest Diagnostics Drug Testing Index™ reported positivity declines for certain prescription opiates in urine drug tests. Oxycodones positivity declined 8.3% between 2012 and 2013 and 12.7% between 2011 and 2012 in the U.S. general workforce. Four states experienced double-digit declines in oxycodones positivity rates in both 2012 and 2013 – Florida, Massachusetts, New Jersey and Ohio. Hydrocodone positivity remained at 1.3% between 2012 and 2013, which is down slightly from its high of 1.4% in 2011.
According to the Monitoring the Future (MTF) study, hydrocodone use by 8th and 10th graders was unchanged while use by 12th graders decreased from 7.5% in 2012 to 5.3% in 2013. OxyContin® use remains unchanged among 8th (2%) and 10th graders (3.4%) and is down slightly among 12th graders (3.6%).
ER data from the Drug Abuse Warning Network (DAWN) revealed that oxycodone is the most frequently mentioned narcotic pain reliever. And data from the National Forensic Laboratory Information System (NFLIS) found that hydrocodone and oxycodone accounted for 68% of all narcotic painkillers but declined between 2011 and 2013 after increasing dramatically between 2002 and 2010.
These various datasets help provide a broader, more comprehensive understanding when assessing drug use trends in the United States. While the rates may vary, they generally provide the same directional information and can help inform employers of what drugs they may need to be concerned about in their drug-free workplace programs.
For more information about drug testing, visit our website.
Over the past few weeks, we used five renowned sources of drug use data to compare and contrast the latest trends in illicit drug use. Read the introductory post to learn more about this series.