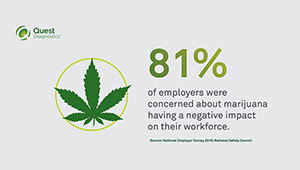
Marijuana use continues to be a complex issue and drug testing provides an objective view into its use in the workforce. Data reveals continual increases in marijuana positivity rates across industries, workforce categories, and specimen types (urine, oral fluid, and hair).
We publish a series of reports and resources that examine the patterns and trends of marijuana use in the American workforce. These tools can help to inform and educate employers as they consider the most effective strategies to create safe, drug-free workplaces.
Marijuana use in the U.S. workplace
Marijuana continues to top the list of the most commonly detected illicit substances across all workforce categories (general U.S. workforce; federally mandated, safety-sensitive workforce; and combined U.S. workforce, which includes the prior two populations) and specimen types (urine, oral fluid, and hair).
The latest Quest Diagnostics Drug Testing Index™ report showed that in the general U.S. workforce, marijuana positivity increased nearly 11 percent in urine testing (2.8% in 2018 versus 3.1% in 2019) and 29 percent since 2015 (2.4%).
“Marijuana continues to be an enduring presence in the U.S. workforce. Changing attitudes toward its use could pose heightened risks especially in safety-sensitive positions and those states exploring legalization,” said Dr. Barry Sample, senior director of science and technology, Quest Diagnostics.
Download our Drug Testing Index brochure.
Marijuana positivity by industry
Marijuana was the most commonly detected drug, with the highest positivity rates, in the majority of sectors in our industry sector-specific data. The Accommodations and Food Service category had the highest workforce positivity for marijuana, at 4.8%, a relative increase of 65 percent over five years (2.9% in 2015 versus 4.8% in 2019).
Marijuana positivity by state
The national positivity rate for marijuana in 2019 was 2.5%. In the Midwest, marijuana positivity outpaced national increases in positivity in 2018 and 2019. Marijuana positivity increased in the Midwest by nearly 14 percent (2.9% in 2018 versus 3.3% in 2019). The West region also outpaced national positivity and saw double digit increases, as compared to the previous year, in 2017 through 2019. Marijuana positivity increased in the West by 24 percent (3.3% in 2018 versus 4.1% in 2019) and 78 percent since 2015 (2.3%).
Marijuana laws by state
States continue to pass legislation regarding permissible uses of marijuana for both medical and recreational purposes. To date, 33 states and Washington, D.C. have medical marijuana laws and 11 of those also passed recreational use laws. Despite ongoing changes to state legislation, marijuana (and its derivatives like CBD), remains part of the federal government’s Controlled Substances Act, and is categorized as a Schedule I controlled substance.
View our infographic to see marijuana laws by state.
Watch a webinar to hear scientific and legal experts discuss topics related to marijuana.
Summary
As an industry leader, we continue to examine the data and uptick of marijuana positivity rates together with the legal status of marijuana by state. The landscape continues to change and the issues become more complex, especially in the workplace. We are committed to providing data and technical expertise to help employers evaluate the big picture. One of our most popular resources, our marijuana white paper, helps to provide insights into the value of drug testing in this new era of marijuana.
For more information about drug testing, visit our website or contact us online.
Updated September 15, 2020


 Your Privacy Choices
|
Privacy Notices
|
Terms
|
Language Assistance / Non-Discrimination Notice | Asistencia de Idiomas / Aviso de no Discriminación | 語言協助 / 不䈚視通知
Your Privacy Choices
|
Privacy Notices
|
Terms
|
Language Assistance / Non-Discrimination Notice | Asistencia de Idiomas / Aviso de no Discriminación | 語言協助 / 不䈚視通知


Marijuana use continues to be a complex issue and drug testing provides an objective view into its use in the workforce. Data reveals continual increases in marijuana positivity rates across industries, workforce categories, and specimen types (urine, oral fluid, and hair).
We publish a series of reports and resources that examine the patterns and trends of marijuana use in the American workforce. These tools can help to inform and educate employers as they consider the most effective strategies to create safe, drug-free workplaces.
Marijuana use in the U.S. workplace
Marijuana continues to top the list of the most commonly detected illicit substances across all workforce categories (general U.S. workforce; federally mandated, safety-sensitive workforce; and combined U.S. workforce, which includes the prior two populations) and specimen types (urine, oral fluid, and hair).
The latest Quest Diagnostics Drug Testing Index™ report showed that in the general U.S. workforce, marijuana positivity increased nearly 11 percent in urine testing (2.8% in 2018 versus 3.1% in 2019) and 29 percent since 2015 (2.4%).
“Marijuana continues to be an enduring presence in the U.S. workforce. Changing attitudes toward its use could pose heightened risks especially in safety-sensitive positions and those states exploring legalization,” said Dr. Barry Sample, senior director of science and technology, Quest Diagnostics.
Download our Drug Testing Index brochure.
Marijuana positivity by industry
Marijuana was the most commonly detected drug, with the highest positivity rates, in the majority of sectors in our industry sector-specific data. The Accommodations and Food Service category had the highest workforce positivity for marijuana, at 4.8%, a relative increase of 65 percent over five years (2.9% in 2015 versus 4.8% in 2019).
Marijuana positivity by state
The national positivity rate for marijuana in 2019 was 2.5%. In the Midwest, marijuana positivity outpaced national increases in positivity in 2018 and 2019. Marijuana positivity increased in the Midwest by nearly 14 percent (2.9% in 2018 versus 3.3% in 2019). The West region also outpaced national positivity and saw double digit increases, as compared to the previous year, in 2017 through 2019. Marijuana positivity increased in the West by 24 percent (3.3% in 2018 versus 4.1% in 2019) and 78 percent since 2015 (2.3%).
Marijuana laws by state
States continue to pass legislation regarding permissible uses of marijuana for both medical and recreational purposes. To date, 33 states and Washington, D.C. have medical marijuana laws and 11 of those also passed recreational use laws. Despite ongoing changes to state legislation, marijuana (and its derivatives like CBD), remains part of the federal government’s Controlled Substances Act, and is categorized as a Schedule I controlled substance.
View our infographic to see marijuana laws by state.
Watch a webinar to hear scientific and legal experts discuss topics related to marijuana.
Summary
As an industry leader, we continue to examine the data and uptick of marijuana positivity rates together with the legal status of marijuana by state. The landscape continues to change and the issues become more complex, especially in the workplace. We are committed to providing data and technical expertise to help employers evaluate the big picture. One of our most popular resources, our marijuana white paper, helps to provide insights into the value of drug testing in this new era of marijuana.
For more information about drug testing, visit our website or contact us online.
Updated September 15, 2020