 Due to the increasing use and abuse of illicit and prescription drugs, employers, public policy decision makers, law enforcement, media and the general public all have an interest in assessing past, current and emerging drug use trends. As such, this installment in our Assessing Drug Use Trends in the United States series uses several renowned sources of drug use data to explore the latest trends in amphetamines use.
Tracking the use of stimulants like Adderall® and Desoxyn® is complex as both of these drugs are available by prescription. However, amphetamine is more commonly associated with prescription use and methamphetamine is more typically associated with illicit use. Amphetamine is also detected as a metabolite when an individual uses methamphetamine. According to data from the Quest Diagnostics Drug Testing Index™ (DTI), there were sharp increases in amphetamine and methamphetamine positivity in 2003 and 2004 followed by steep declines in 2005 and 2006. It stands to reason that law enforcement efforts limited the availability of illicit methamphetamine crossing the country border, while increased pharmacy restrictions for certain over-the-counter medications inhibited the illicit manufacturing of these drugs in clandestine laboratories. However, while methamphetamine positivity continued to decline, amphetamine positivity began to increase and is now at its highest level on record.
Drug seizure data from the National Forensic Laboratory Information System (NFLIS) has generally shown increases in methamphetamine seizure since 2010. Nationally, it is the third most frequently identified drug and is the most frequently identified drug in the western United States. The estimated number of current methamphetamine users is 595,000 which is similar to 2012 (440,000) and 2011 (439,000) but significantly higher than 2010 (353,000). This increase in methamphetamine use started to appear in the 2012 and 2013 DTI data when the positivity rate increased by double digits in both oral fluid and urine U.S. general workforce drug tests and in 2013 hair drug test data when it increased by more than 5%. In oral fluid, the positivity rate increased 33% between 2011 and 2012 and 50% between 2012 and 2013. In urine, the positivity rate increased 22% between 2011 and 2012 and 27% between 2012 and 2013. The usage rates from the Monitoring the Future survey have been holding steady (1% or less among all grade levels) while the Drug Abuse Warning Network (DAWN) ER data shows a 68% increase in illicit stimulant (primarily amphetamine and methamphetamine) mentions between 2009 and 2011.
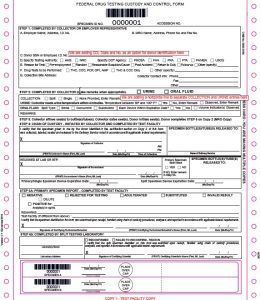
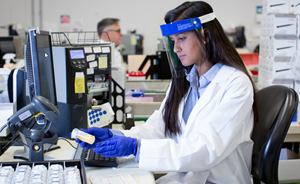
With amphetamines use increasing, it’s important to drug test employees and job applicants to help keep workplaces safe. For more information about drug testing, visit our website or contact us online.
Join us over the next few weeks as we use five renowned sources of drug use data to compare and contrast the latest trends in illicit drug use. Read the introductory post to learn more about this series.


Tracking the use of stimulants like Adderall® and Desoxyn® is complex as both of these drugs are available by prescription. However, amphetamine is more commonly associated with prescription use and methamphetamine is more typically associated with illicit use. Amphetamine is also detected as a metabolite when an individual uses methamphetamine. According to data from the Quest Diagnostics Drug Testing Index™ (DTI), there were sharp increases in amphetamine and methamphetamine positivity in 2003 and 2004 followed by steep declines in 2005 and 2006. It stands to reason that law enforcement efforts limited the availability of illicit methamphetamine crossing the country border, while increased pharmacy restrictions for certain over-the-counter medications inhibited the illicit manufacturing of these drugs in clandestine laboratories. However, while methamphetamine positivity continued to decline, amphetamine positivity began to increase and is now at its highest level on record.
Drug seizure data from the National Forensic Laboratory Information System (NFLIS) has generally shown increases in methamphetamine seizure since 2010. Nationally, it is the third most frequently identified drug and is the most frequently identified drug in the western United States. The estimated number of current methamphetamine users is 595,000 which is similar to 2012 (440,000) and 2011 (439,000) but significantly higher than 2010 (353,000). This increase in methamphetamine use started to appear in the 2012 and 2013 DTI data when the positivity rate increased by double digits in both oral fluid and urine U.S. general workforce drug tests and in 2013 hair drug test data when it increased by more than 5%. In oral fluid, the positivity rate increased 33% between 2011 and 2012 and 50% between 2012 and 2013. In urine, the positivity rate increased 22% between 2011 and 2012 and 27% between 2012 and 2013. The usage rates from the Monitoring the Future survey have been holding steady (1% or less among all grade levels) while the Drug Abuse Warning Network (DAWN) ER data shows a 68% increase in illicit stimulant (primarily amphetamine and methamphetamine) mentions between 2009 and 2011.
With amphetamines use increasing, it’s important to drug test employees and job applicants to help keep workplaces safe. For more information about drug testing, visit our website or contact us online.
Join us over the next few weeks as we use five renowned sources of drug use data to compare and contrast the latest trends in illicit drug use. Read the introductory post to learn more about this series.